
Market Overview June 25: Tech Giants of Asia and the USA Take Off, Yen Hits a Low of 161.8, and Investors Await GDP and PCE Inflation
Global financial markets on June 25, 2026, continue to recover after a recent correction. The main driver of growth has been a strong rebound in the tech sector of the USA and Asia, supported by positive forecasts.
Global financial markets on June 25, 2026 continue to recover after a recent correction. The main driver of growth has been a strong rebound in the tech sector of the USA and Asia, supported by positive forecasts from major semiconductor manufacturers. At the same time, the oil market remains under pressure amid progress in negotiations between the USA and Iran, while investors are focusing on key macroeconomic statistics from the USA.
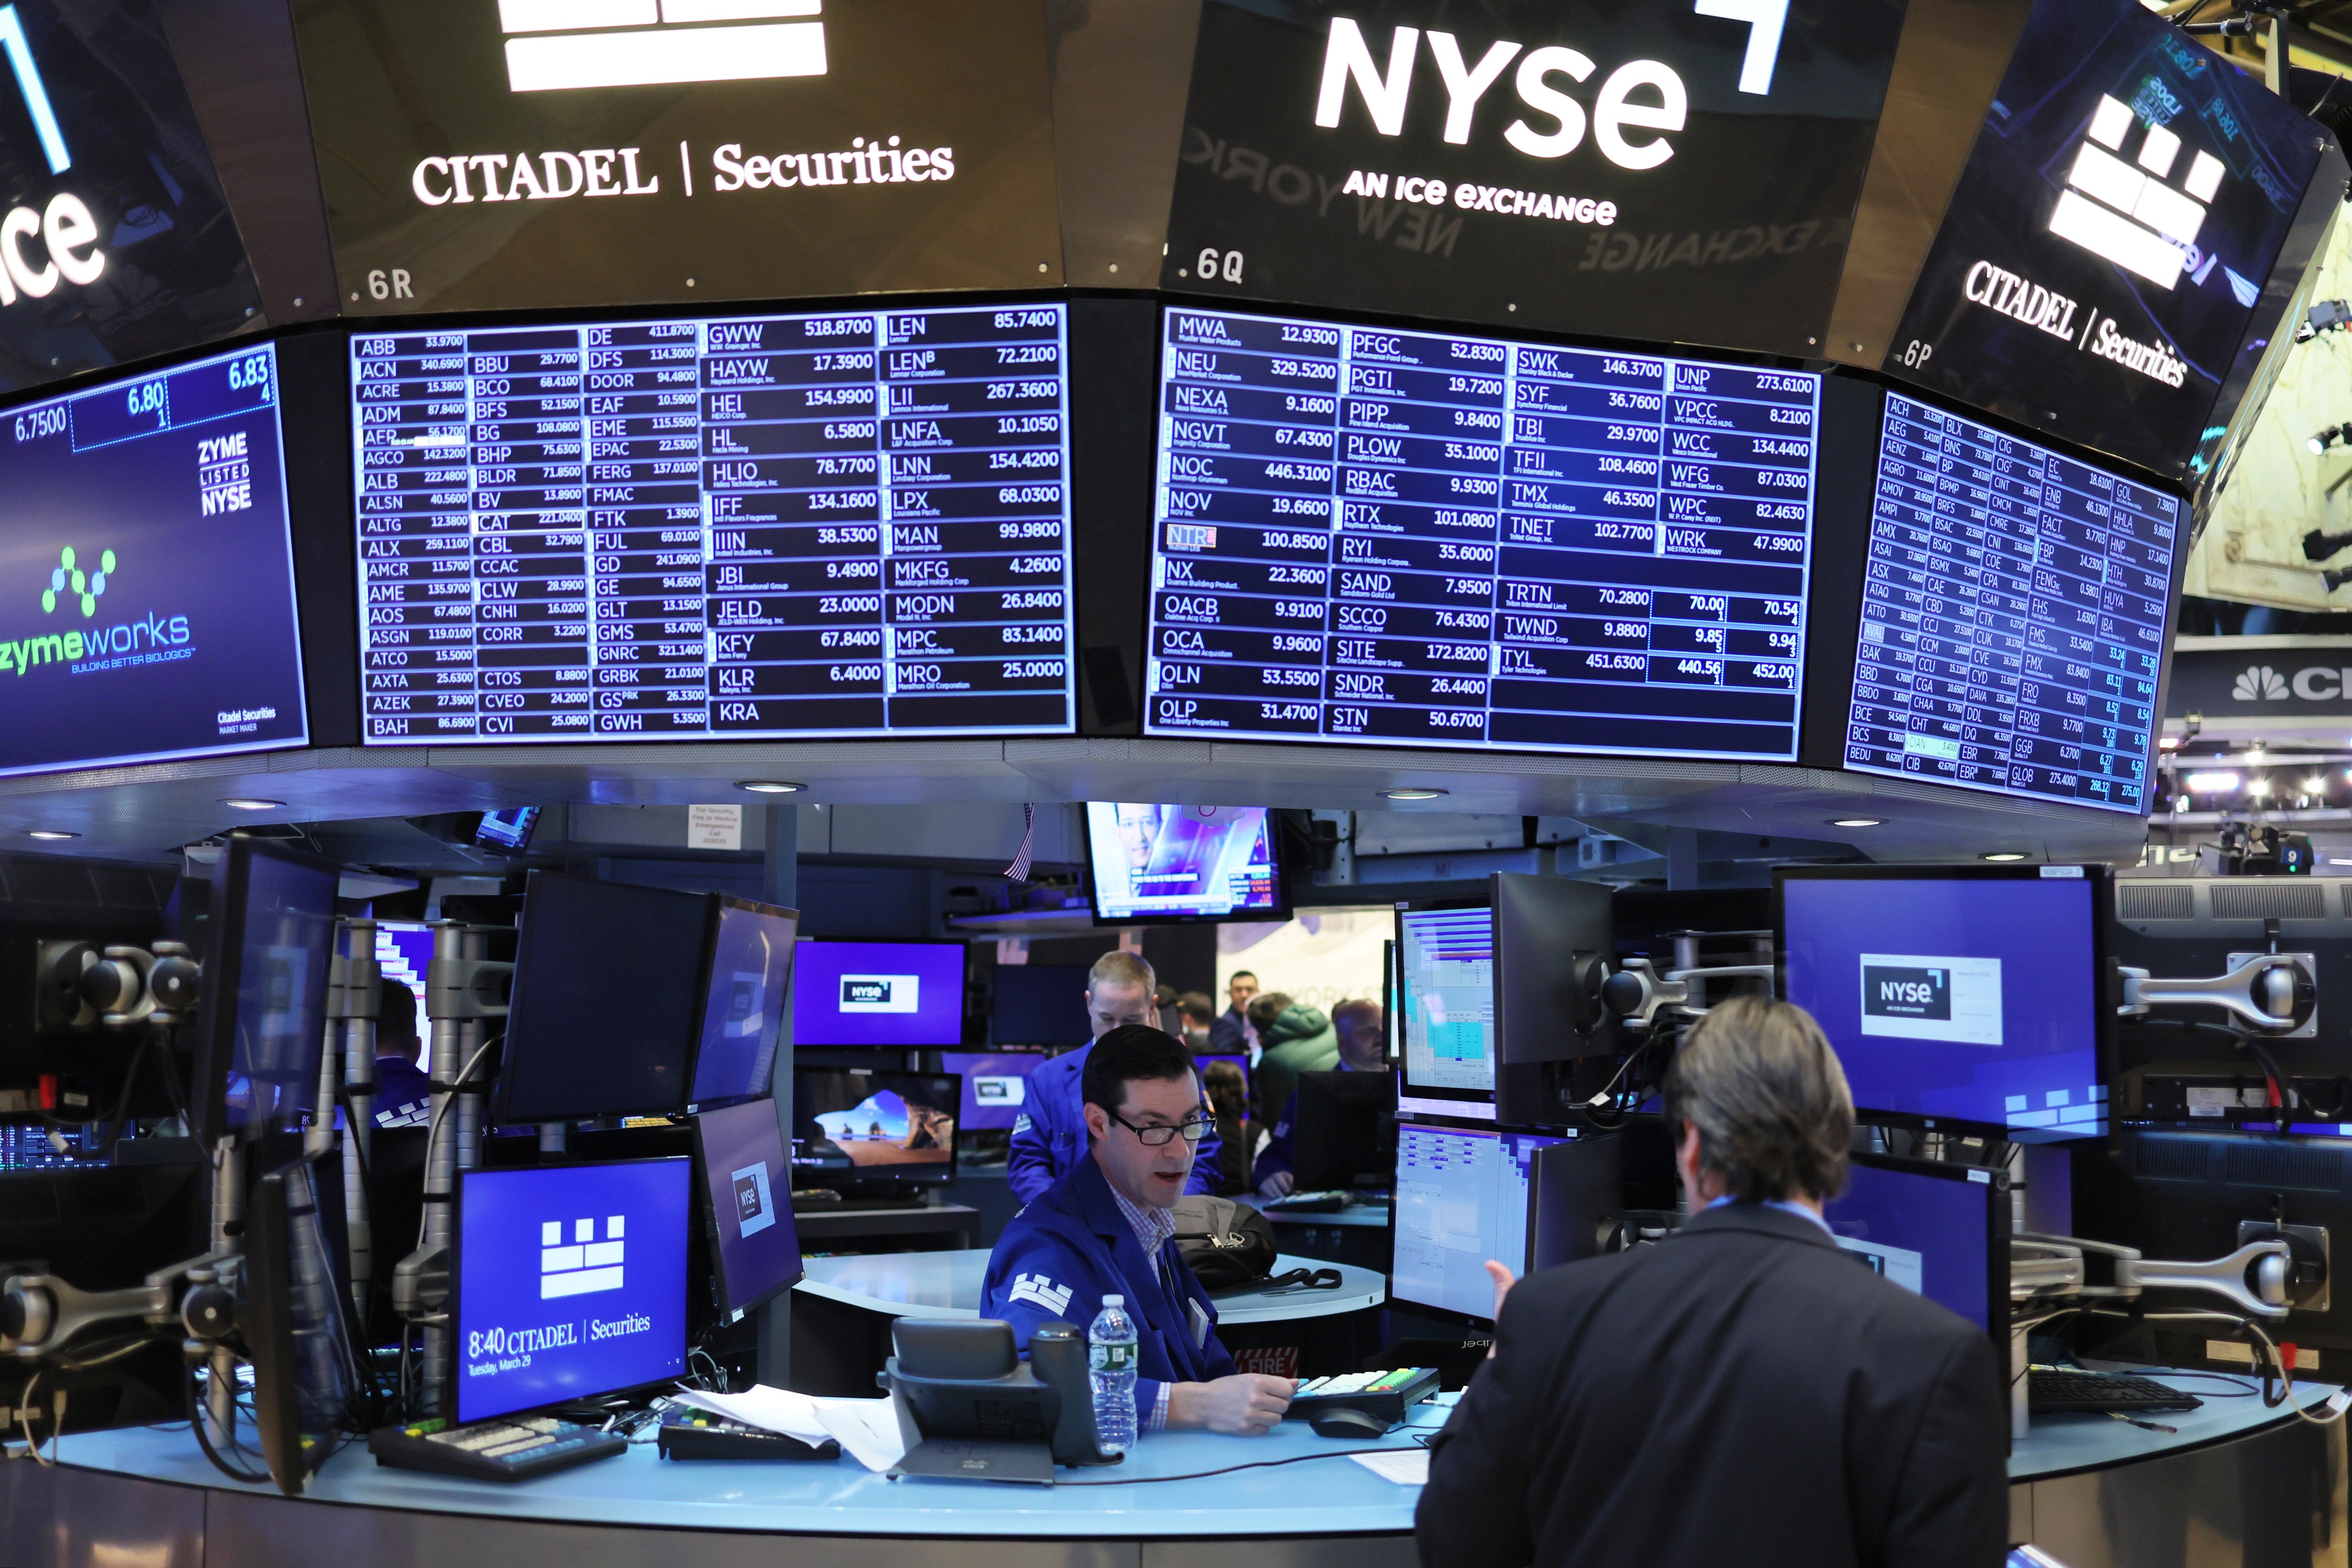
📈 Stock Markets: USA Returns to Buying
American futures are trading in the green as the market gradually returns to buying tech companies. Additional support for the sector comes from strong forecasts from Micron and Qualcomm, which have alleviated concerns about overheating in the artificial intelligence market.
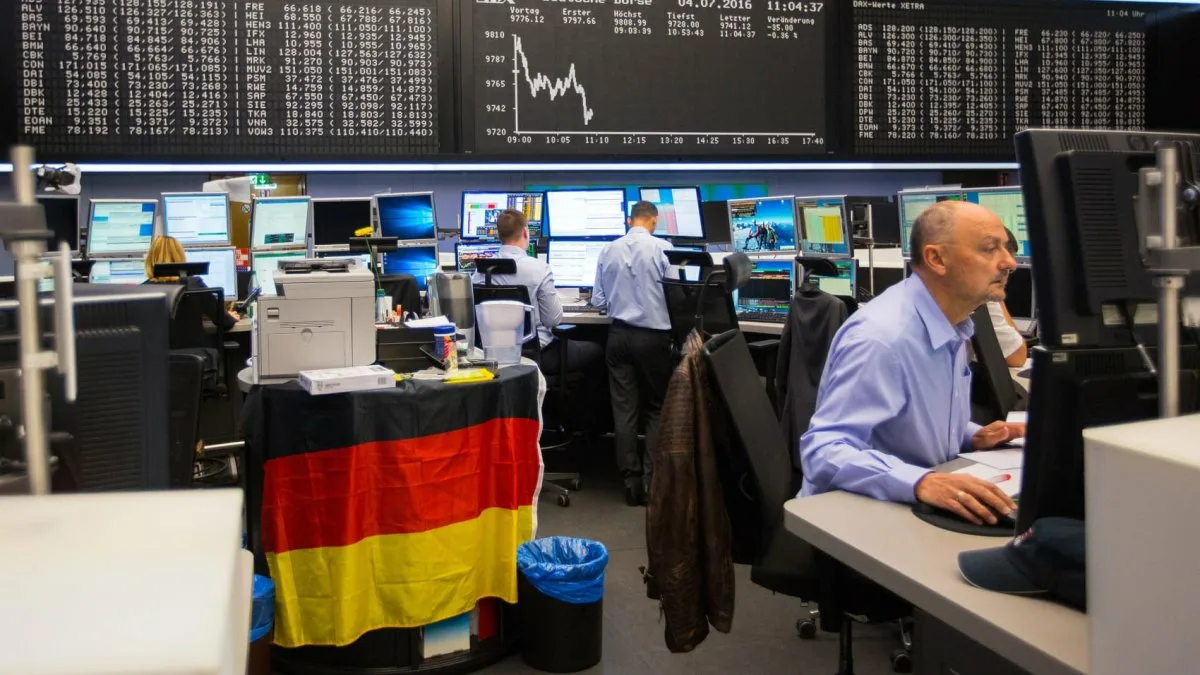
🇪🇺 Europe: Mixed Dynamics and Earnings Reports Awaited
European markets are showing mixed dynamics. Pressure on the region's indices remains due to several key factors:
• weak manufacturing indicators;
• current tariff risks;
• cautious and balanced position of the ECB.
Meanwhile, investors are keenly awaiting fresh corporate earnings reports from major players like H&M, Wise, and Serco Group.

🇯🇵 Asia: Unconditional Leaders of Today's Session
Asian markets have become the leaders of today's session. The strong and rapid growth of the indices is actively supported by the following important triggers:
• full recovery of the tech sector;
• official plans by SK Hynix to list on the American Nasdaq exchange;
• high sustained demand for memory and semiconductor manufacturers.

🛢️ Commodity Market: Oil at Lows, Gold Declines
Oil
After a sharp decline, prices remain near local lows. Brent is trading around $73, while American WTI is around $70.5 per barrel. The main reason is the decrease in geopolitical tension following agreements between the USA and Iran and the resumption of full tanker movement through the Strait of Hormuz.
Gold
Gold continues to decline. The price of an ounce has fallen below the important mark of $4000, as a strong dollar and expectations of further tightening of monetary policy by the Fed significantly reduce demand for safe-haven assets.
💵 Currency Market: Strength of DXY and Yen Intervention Risks
The US dollar index (DXY) remains strong, confidently holding around the level of 101.5 points. Against this backdrop, the EUR/USD currency pair remains under pressure.
Meanwhile, the Japanese yen is trading near multi-year lows (around 161.8 JPY per dollar), which significantly increases market participants' expectations regarding a possible large-scale currency intervention by the Bank of Japan.

₿ Cryptocurrencies: Stabilization After Correction
After a prolonged period of correction, the cryptocurrency market has finally stabilized. The main cryptocurrency Bitcoin is holding around $61,500, while Ethereum is trading in a sideways corridor without a clear direction. The main factor restraining pressure on digital assets remains the expectation of further Fed decisions on interest rates.
📅 Key Events of the Day (Kazakhstan Time, UTC+5)
⏱️ 17:30 — US GDP for Q1 2026
⏱️ 17:30 — PCE Price Index (May)
⏱️ 17:30 — Initial Jobless Claims
⏱️ 17:30 — Durable Goods Orders (May)
⏱️ 19:30 — Natural Gas Stocks in the USA (EIA)
⏱️ 20:00 — Kansas City Fed Manufacturing Activity Index
⚠️ What is Currently in Focus:
- 📌 US GDP publication;
- 📌 PCE inflation index — the main benchmark for the Fed;
- 📌 further expectations on interest rates;
- 📌 recovery of the tech sector;
- 📌 oil dynamics after the US-Iran agreement;
- 📌 corporate reports from the largest global companies.
⚡ Summary: Markets continue to gradually recover after a recent correction. The main driver remains the tech sector of the USA and Asia, however, the further direction of movement today will largely be determined by data on US GDP, the PCE index, and statistics on the American labor market. At the same time, investors continue to monitor oil prices, the Fed's rhetoric, and the developments in the Middle East.